
Who uses this: Admins have full reporting access, and Team Managers can be given it. Service Agents and Limited Agents do not have reporting access. Availability: All regions.An asset report is built from the Asset tab in raw data reporting, and it pulls the equipment you install and service — warranty dates, manufacturer, model, serial number, and asset type — into one table. That table is how you find the equipment aging out of warranty before the customer calls.
Overview
An asset report answers one question about your installed base: which pieces of equipment match the conditions you care about. Use it to find every unit whose parts or labor warranty is about to expire, group assets by manufacturer or asset type, and pull the model and serial details you need before a maintenance visit. Building an asset report follows the same path as every other raw data report — set a date range, choose the columns, set filters, then read the table. Asset reporting is part of FieldPulse’s dashboards and reporting. For the parts of the reporting flow that are the same on every record type — saving a report, adding it to your dashboard, and exporting to CSV — see How to Use Raw Data Reporting.Video walkthrough
Video walkthrough: Creating a report in raw data reporting
Before you begin
- Create the assets you want to report on. See How to Manage Assets.
- Check that your role has reporting access. An Admin has full reporting access; a Team Manager needs Full Reporting access turned on.
Set the date range
- Select Reporting under the Management tab in the left-side menu.
- Select the Asset tab, then select Raw Data.
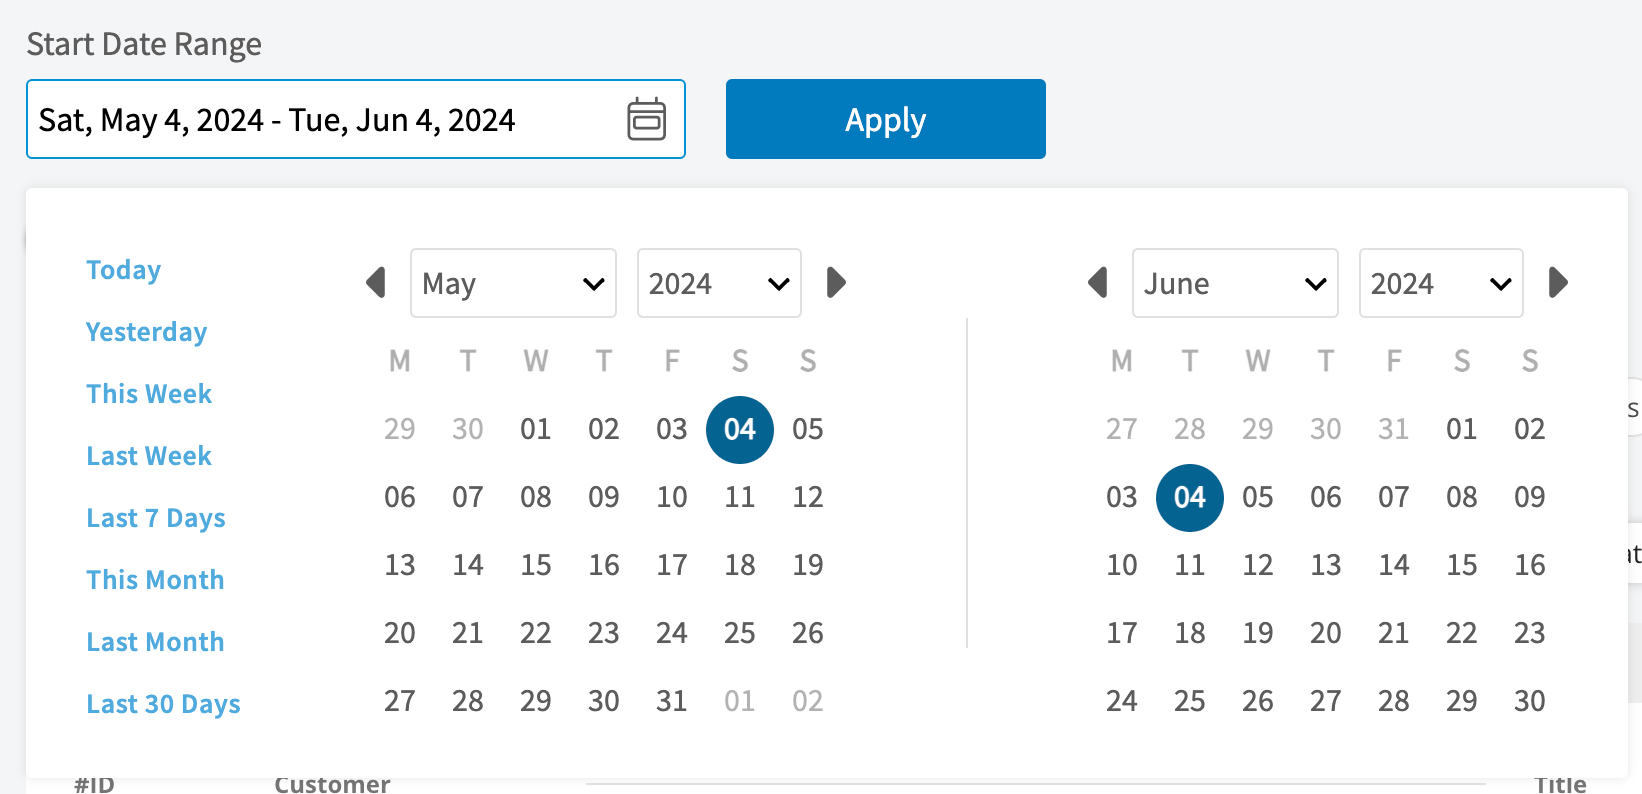
- Select the calendar icon and choose the start date range you want to report on.
- Select Load Data.
Choose your columns
Select Columns to choose which asset fields appear in the report table and the order they appear in.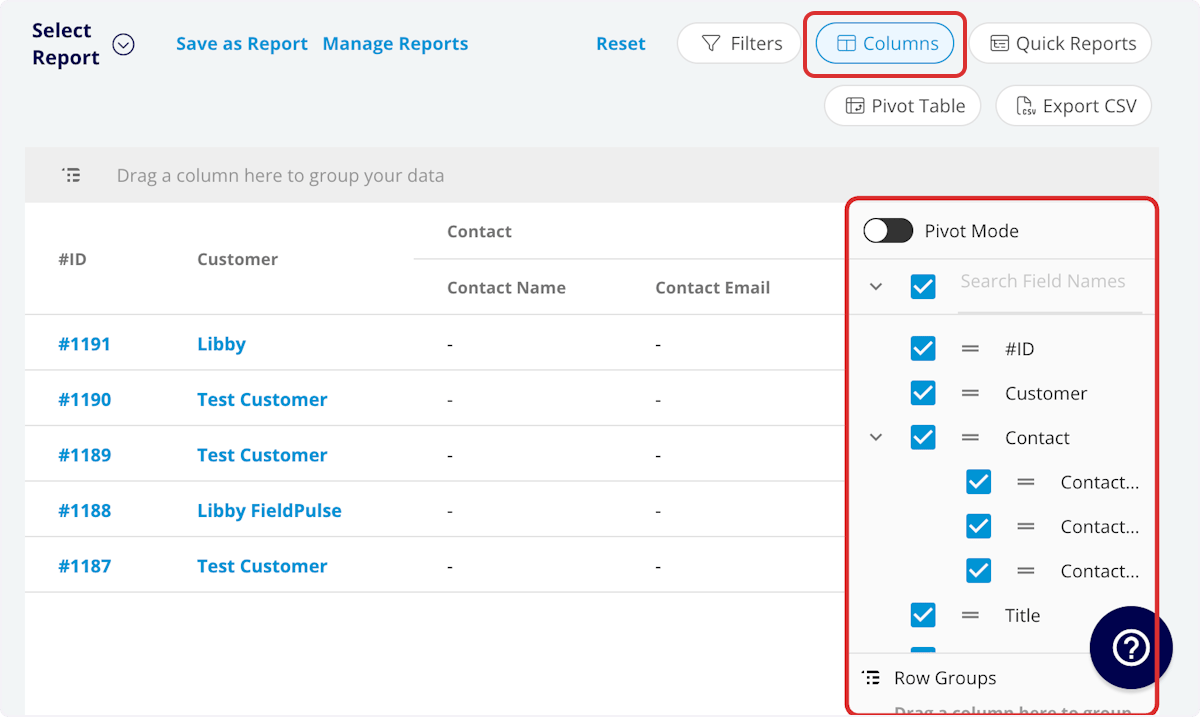
Set your filters
Before running the report, set filters to narrow the results. Select the Filters icon, then choose how you want to filter the report.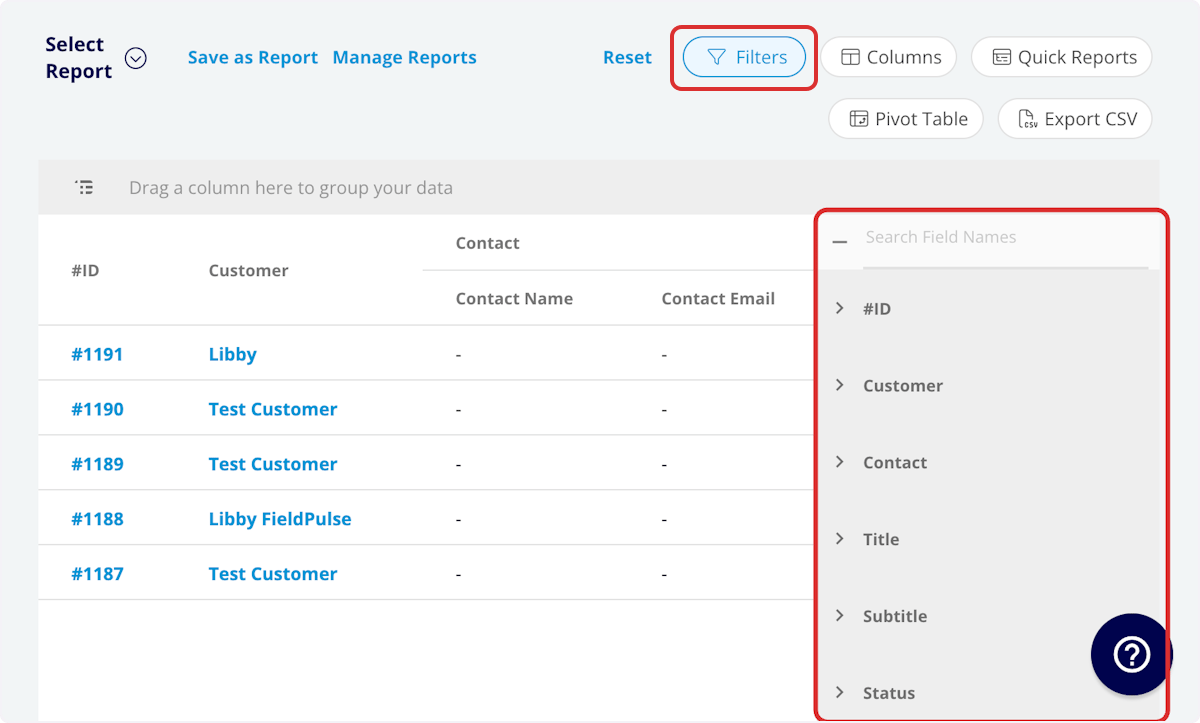
Filter operators
When you filter by contents, choose an operator and then enter the values to filter the data on.Tips
- To build a renewal or follow-up list, keep Customer, Manufacturer, Model, and one of the warranty expiration columns, then filter on the expiration date.
- Serial Number and Model Number turn the report into a fast lookup for ordering the right part before you send a tech out.
FAQs
Can I save an asset report to use again?
Yes. Select Save as Report, then Save as New to store it under Select Report, or Save as Widget to add it to your Pulse Dashboard. See How to Use Raw Data Reporting for the full saving flow.Can I export an asset report to a spreadsheet?
Yes. Select Export CSV to download the report currently on your screen as a CSV file to your device.Related articles
- How to Use Raw Data Reporting
- How to Manage Assets
- Company Equipment & Asset Tracking Overview
- How to Create Maintenance Agreement Reports