
Who uses this: Admins have Full Reporting access, and Team Managers can be given it. Service Agents and Limited Agents do not have Full Reporting access. Availability: All regions.The Jobs > Tasks tab in raw data reporting pulls task records — category, status, schedule, assigned users, durations, and the totals on the related estimate and invoice — into one table you can filter, group, and export.
Overview
A task report answers what task work is on the books and who is carrying it, because the task record holds the customer, the category, the status, the schedule, the assigned team members, and the related estimate and invoice totals. Grouping on the Category Name column sorts your tasks by category, for a clearer view of the frequency and duration of each task category. Common task reports include tasks by category and tasks by customer. Building a task report follows the same path as every other raw data report — set a date range, choose the columns, set filters, then read the table. Task reporting is part of FieldPulse’s dashboards and reporting. For the parts of the reporting flow that are the same on every record type — saving a report, adding it to your dashboard, and exporting to CSV — see How to Use Raw Data Reporting.Video walkthrough
Video walkthrough: Creating a report in raw data reporting
Before you begin
- Create the tasks you want to report on. See How to Create a Task.
- Check that your role has Full Reporting access. Admins have it; Team Managers need it turned on.
Set the date range
- Select Reporting under the Management tab in the left-side menu.
- Select the Jobs > Tasks tab, then select Raw Data.
- Select the calendar icon and choose the start date range you want to report on.
- Select Load Data.
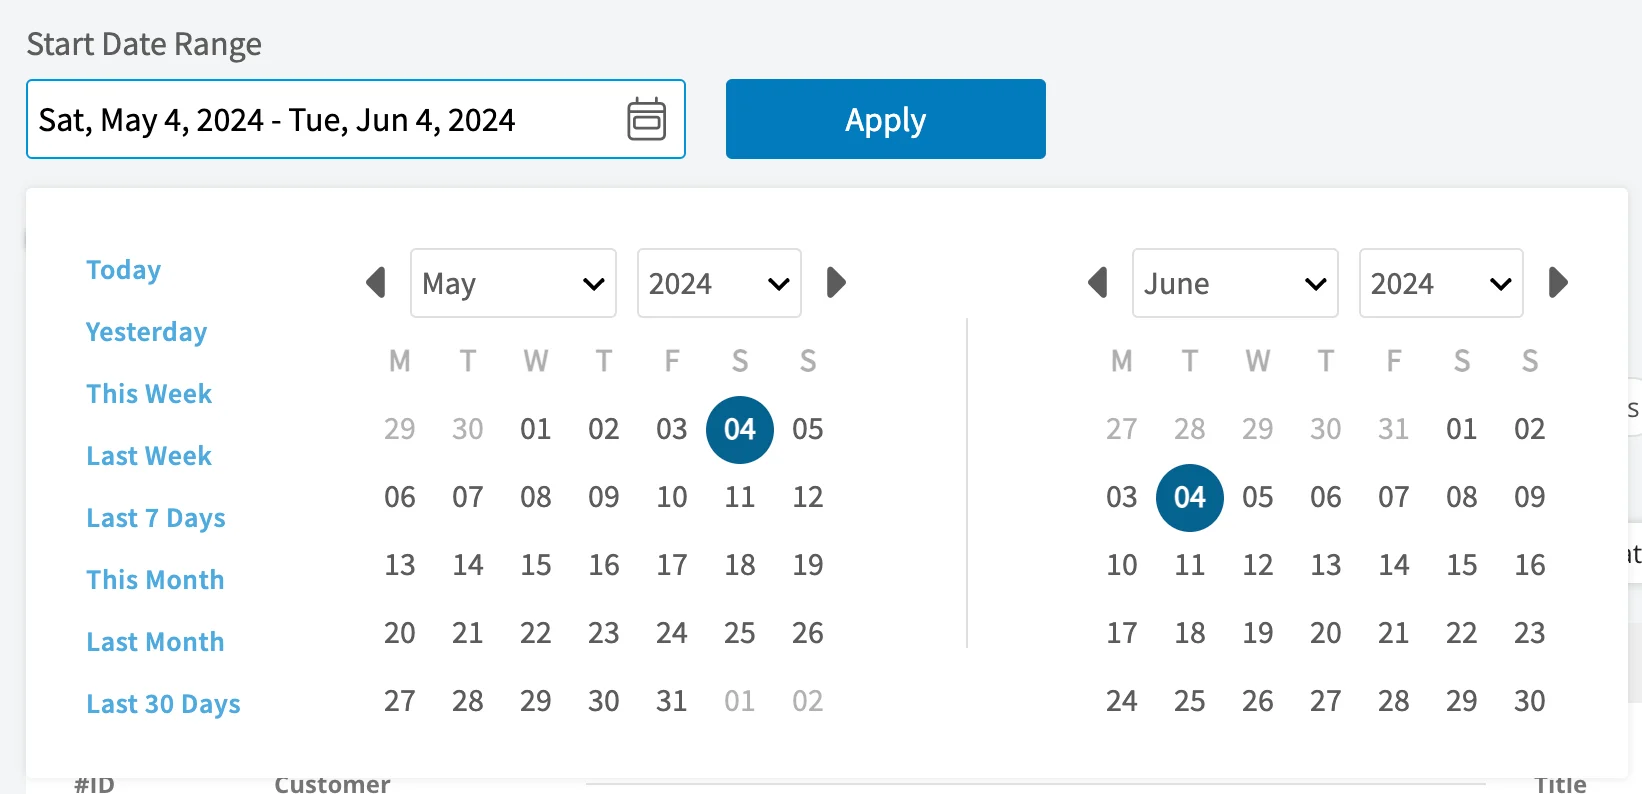
Choose your columns
Select Columns to choose which task fields appear in the report table and the order they appear in.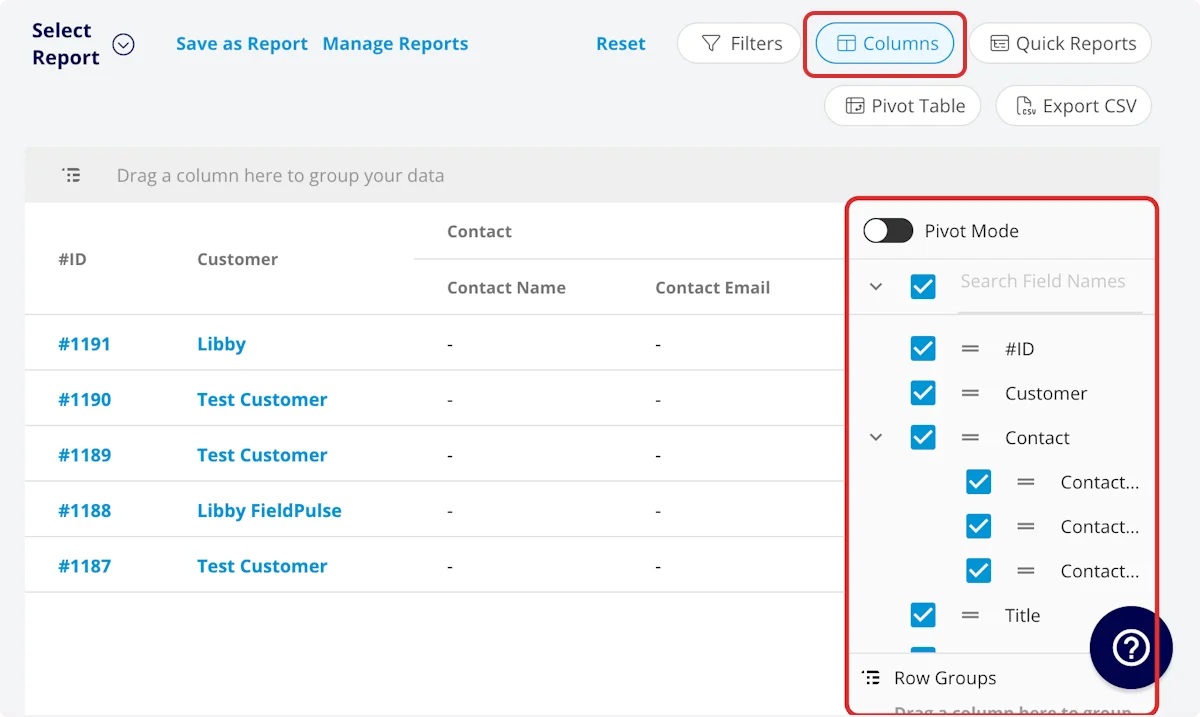
The report also includes a Clock In Date/Time column and a Clock Out Date/Time column.
The Customer group carries these fields from the customer record onto the task:
Set your filters
Before running the report, set filters to narrow the results. Select the Filters icon, then choose how you want to filter the report.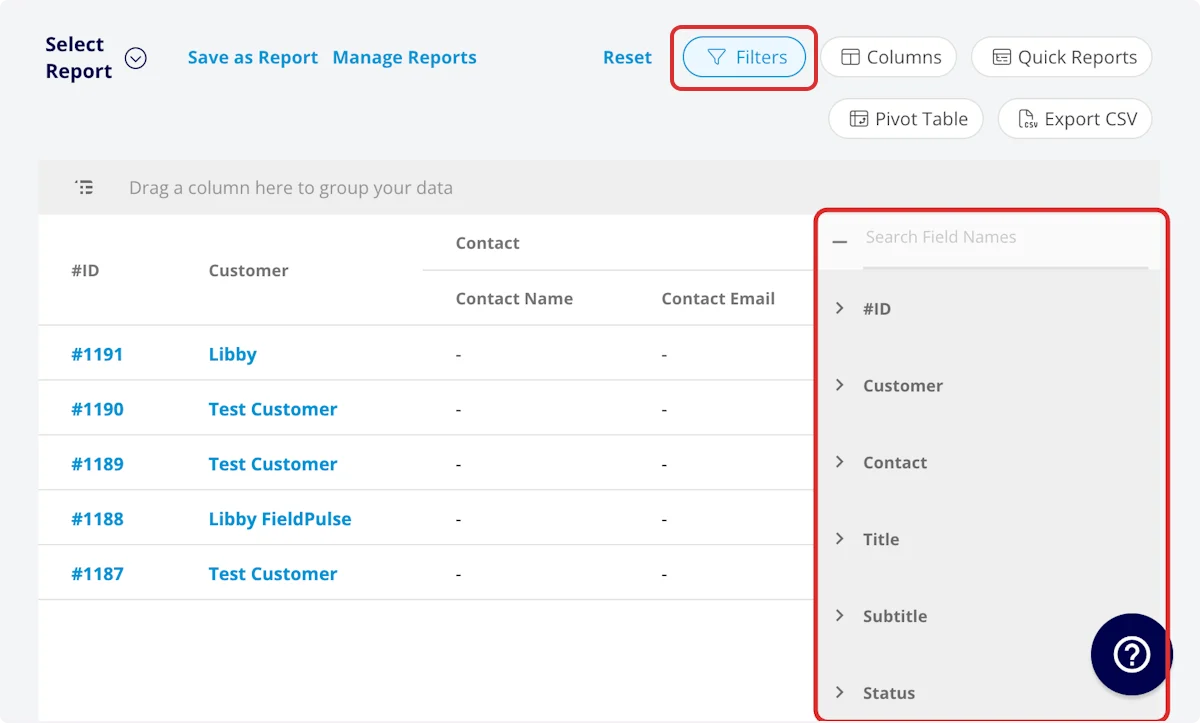
Filter operators
When you filter by contents, choose an operator and then enter the values to filter the data on.Common task reports
These are the column and grouping combinations for two common task reports.Tasks by category
Use this report to sort your tasks by category, for a clearer view of the frequency and duration of each task category. Customize the columns to your needs, but include Category Name, and group by Category Name.Tasks by customer
Use this report to sort your tasks by customer. Customize the columns to your needs, but include Customer, and group by Customer.Video walkthrough: Building the tasks by category and tasks by customer reports
FAQs
Can I save a task report to use again?
Yes. Select Save as Report, then Save as New to store it under Select Report, or Save as Widget to add it to your Pulse Dashboard. See How to Use Raw Data Reporting for the full saving flow.Can I export a task report to a spreadsheet?
Yes. Select Export CSV to download the report currently on your screen as a CSV file. See How to Use Raw Data Reporting for the full export flow.Related articles
- How to Use Raw Data Reporting
- How to Create a Task
- How to Create Subtask Reports
- How to Create Job Reports
- How to Create Customer Reports